
3.1 Key figures
3.2 Multi-year figures
| In millions of euros (where applicable) | 2024/2025 | 2023/2024 | 2022/2023 |
|---|---|---|---|
| Gross turnover | 805,0 | 822,8 | 855,2 |
| Net turnover | 766,0 | 781,4 | 803,8 |
| Operating result | 16,3 | 34,5 | 35,7 |
| Financial income and expense | 10,1 | 14,4 | 9,6 |
| Cooperative result after taxes | 5,1 | 2,6 | 20,8 |
| Depreciation | 43,3 | 41,1 | 41,3 |
| Investments in tangible fixed assets | 60,0 | 38,2 | 40,1 |
| Group equity | 252,4 | 247,3 | 222,0 |
| Liabilities including provisions | 433,0 | 424,4 | 502,2 |
| Total assets | 685,4 | 671,7 | 724,2 |
| Group equity as % of total assets | 36,8 | 36,8 | 30,7 |
| Net cash flow before financing activities | 7,1 | 45,6 | -64,7 |
| Net debt to banks | 309,6 | 317,3 | 359,5 |
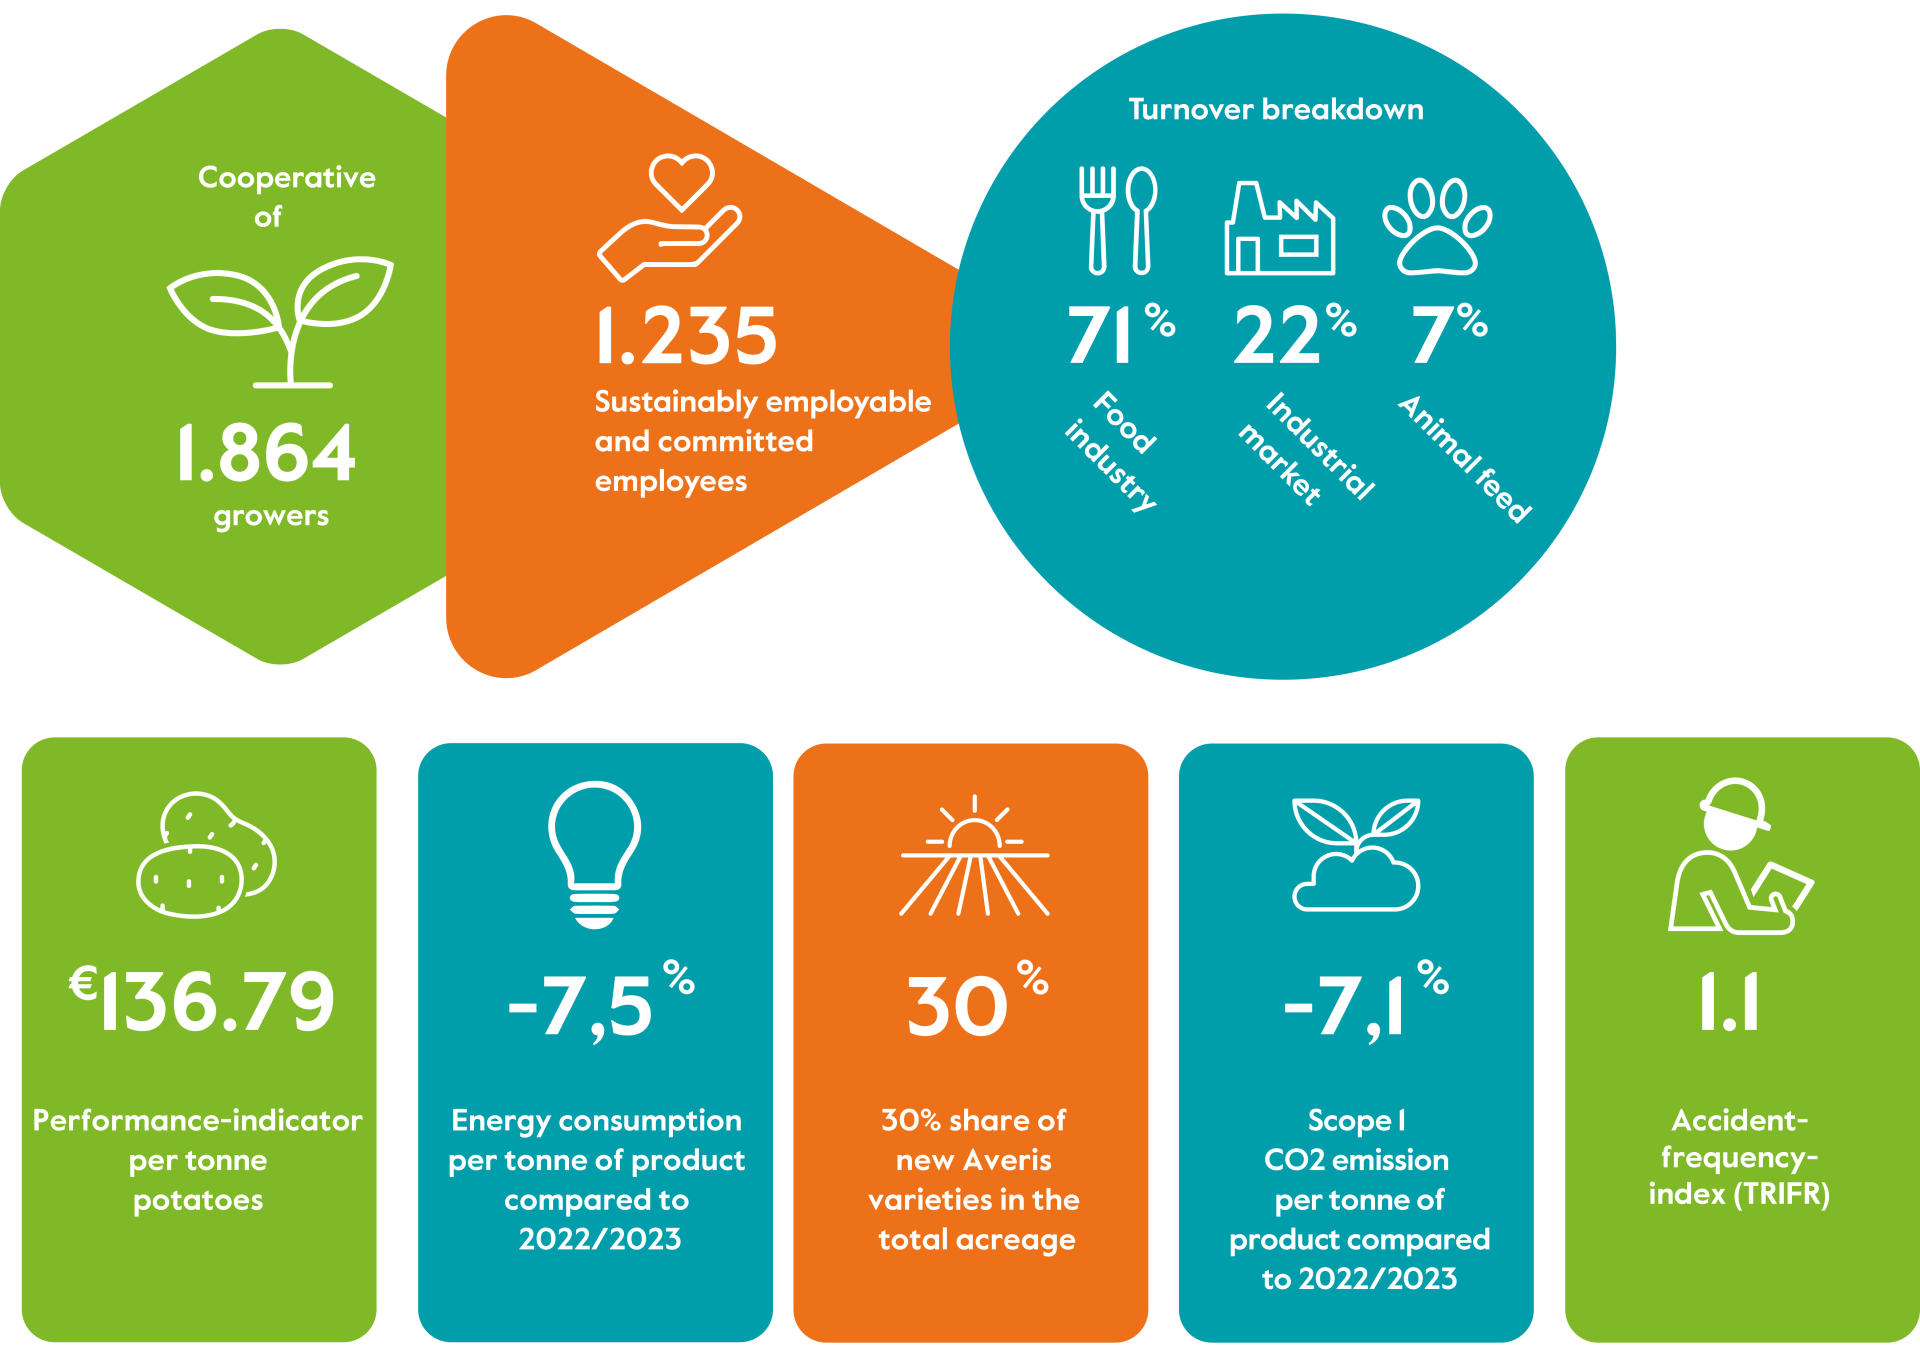
| Performance indicator (EUR/ton)* | 136,79 | 118,62 | 133,34 |
| *The performance indicator comprises the payments for the delivered potatoes plus the net result divided by the tonnage delivered by members on shares. Calculated as a starch percentage of 19% (underwater weight of 470 grams). | |||
3.3 Social key figures
Number of employees including externals
Bovenstaande grafiek in tabel-vorm:
| Country | aantal |
|---|---|
| Netherlands | 1042 |
| Germany | 164 |
| Sweden | 70 |
| Other | 45 |
Full-time employees (%)
Bovenstaande grafiek in tabel-vorm:
| Country | aantal % |
|---|---|
| Netherlands | 87% |
| Germany | 85% |
| Sweden | 99% |
| Other | 98% |
Employees on permanent contracts (%)
Bovenstaande grafiek in tabel-vorm:
| Country | aantal % |
|---|---|
| Netherlands | 97% |
| Germany | 98% |
| Sweden | 94% |
| Other | 98% |
Gender of employees (%)
Bovenstaande grafiek in tabel-vorm:
| men | women | |
|---|---|---|
| Netherlands | 84 | 16 |
| Germany | 70 | 30 |
| Sweden | 87 | 13 |
| Other | 49 | 51 |